from siuba import _, group_by, summarize
from siuba.data import mtcars

(mtcars
  >> group_by(_.cyl)
  >> summarize(avg_hp = _.hp.mean())
)| cyl | avg_hp | |
|---|---|---|
| 0 | 4 | 82.636364 |
| 1 | 6 | 122.285714 |
| 2 | 8 | 209.214286 |
Siuba is a tool for concise, flexible data-analysis over multiple data sources. It currently supports pandas DataFrames and SQL tables.
pip install siubaThe code below uses the example DataFrame mtcars, to get the average horsepower (hp) per cylinder.
from siuba import _, group_by, summarize
from siuba.data import mtcars
(mtcars
>> group_by(_.cyl)
>> summarize(avg_hp = _.hp.mean())
)| cyl | avg_hp | |
|---|---|---|
| 0 | 4 | 82.636364 |
| 1 | 6 | 122.285714 |
| 2 | 8 | 209.214286 |
There are three key concepts in this example:
| concept | example | meaning |
|---|---|---|
| verb | group_by(...) |
a function that operates on a table, like a DataFrame or SQL table |
| lazy expression | _.hp.mean() |
an expression created with siuba._, that represents actions you want to perform |
| pipe | mtcars >> group_by(...) |
a syntax that allows you to chain verbs with the >> operator |
_)A siu expression is a way of specifying what action you want to perform. This allows siuba verbs to decide how to execute the action, depending on whether your data is a local DataFrame or remote table.
from siuba import _

_.cyl == 4
█─==
├─█─.
│ ├─_
│ └─'cyl'
└─4Notice how the output represents each step in our lazy expression, with these pieces:
==) or getting an attribute (.)._) - a placeholder for a table of data.We can use these expressions like lambda functions. For example, to keep specific rows of a pandas DataFrame.
# old approach: repeat name
mtcars[mtcars.cyl == 4]

# old approach: lambda
mtcars[lambda _: _.cyl == 4]

# siu approach
mtcars[_.cyl == 4]| mpg | cyl | disp | hp | drat | wt | qsec | vs | am | gear | carb | |
|---|---|---|---|---|---|---|---|---|---|---|---|
| 2 | 22.8 | 4 | 108.0 | 93 | 3.85 | 2.320 | 18.61 | 1 | 1 | 4 | 1 |
| 7 | 24.4 | 4 | 146.7 | 62 | 3.69 | 3.190 | 20.00 | 1 | 0 | 4 | 2 |
| ... | ... | ... | ... | ... | ... | ... | ... | ... | ... | ... | ... |
| 27 | 30.4 | 4 | 95.1 | 113 | 3.77 | 1.513 | 16.90 | 1 | 1 | 5 | 2 |
| 31 | 21.4 | 4 | 121.0 | 109 | 4.11 | 2.780 | 18.60 | 1 | 1 | 4 | 2 |
11 rows × 11 columns
Note that like the lambda function, siuba avoids typing the same (potentially_very_long) name twice, while also being a bit shorter.
Verbs are functions that operate on a table of data. They can be combined using a pipe with the >> operator.
from siuba import _, mutate, filter, group_by, summarize
from siuba.data import mtcarsThe previous example can be re-written in siuba as the following.
(mtcars
  >> group_by(_.cyl)
  >> mutate(demeaned = _.hp - _.hp.mean())
  )
(grouped data frame)
| mpg | cyl | disp | hp | drat | wt | qsec | vs | am | gear | carb | demeaned | |
|---|---|---|---|---|---|---|---|---|---|---|---|---|
| 0 | 21.0 | 6 | 160.0 | 110 | 3.90 | 2.620 | 16.46 | 0 | 1 | 4 | 4 | -12.285714 |
| 1 | 21.0 | 6 | 160.0 | 110 | 3.90 | 2.875 | 17.02 | 0 | 1 | 4 | 4 | -12.285714 |
| ... | ... | ... | ... | ... | ... | ... | ... | ... | ... | ... | ... | ... |
| 30 | 15.0 | 8 | 301.0 | 335 | 3.54 | 3.570 | 14.60 | 0 | 1 | 5 | 8 | 125.785714 |
| 31 | 21.4 | 4 | 121.0 | 109 | 4.11 | 2.780 | 18.60 | 1 | 1 | 4 | 2 | 26.363636 |
32 rows × 12 columns
Note that there is a key difference: mutate returned a pandas DataFrame with the new column (demeaned) at the end. This is a core feature of siuba verbs–tables in and tables out.
Below are examples of keeping certain rows with filter, and calculating a single number per group with summarize.
g_cyl = group_by(mtcars, _.cyl)

# keep lowest hp per group
g_cyl >> filter(_.hp == _.hp.min())
(grouped data frame)
| mpg | cyl | disp | hp | drat | wt | qsec | vs | am | gear | carb | |
|---|---|---|---|---|---|---|---|---|---|---|---|
| 5 | 18.1 | 6 | 225.0 | 105 | 2.76 | 3.460 | 20.22 | 1 | 0 | 3 | 1 |
| 18 | 30.4 | 4 | 75.7 | 52 | 4.93 | 1.615 | 18.52 | 1 | 1 | 4 | 2 |
| 21 | 15.5 | 8 | 318.0 | 150 | 2.76 | 3.520 | 16.87 | 0 | 0 | 3 | 2 |
| 22 | 15.2 | 8 | 304.0 | 150 | 3.15 | 3.435 | 17.30 | 0 | 0 | 3 | 2 |
g_cyl >> summarize(avg_hp = _.hp.mean())| cyl | avg_hp | |
|---|---|---|
| 0 | 4 | 82.636364 |
| 1 | 6 | 122.285714 |
| 2 | 8 | 209.214286 |
The verbs above received a few different calculations as arguments:
_.hp.mean()_.hp.min()You can use any methods from the underlying pandas objects as methods.
# outside
mtcars.shape[0] + 1

# inside mutate
mtcars >> mutate(res = _.shape[0] + 1)| mpg | cyl | disp | hp | drat | wt | qsec | vs | am | gear | carb | res | |
|---|---|---|---|---|---|---|---|---|---|---|---|---|
| 0 | 21.0 | 6 | 160.0 | 110 | 3.90 | 2.620 | 16.46 | 0 | 1 | 4 | 4 | 33 |
| 1 | 21.0 | 6 | 160.0 | 110 | 3.90 | 2.875 | 17.02 | 0 | 1 | 4 | 4 | 33 |
| ... | ... | ... | ... | ... | ... | ... | ... | ... | ... | ... | ... | ... |
| 30 | 15.0 | 8 | 301.0 | 335 | 3.54 | 3.570 | 14.60 | 0 | 1 | 5 | 8 | 33 |
| 31 | 21.4 | 4 | 121.0 | 109 | 4.11 | 2.780 | 18.60 | 1 | 1 | 4 | 2 | 33 |
32 rows × 12 columns
This includes the str and dt attribute accessor methods:
import pandas as pd

df = pd.DataFrame({"x": ["apple", "banana"]})

# outside
df.x.str.contains("a")

# inside mutate
df >> mutate(res = _.x.str.contains("a"))| x | res | |
|---|---|---|
| 0 | apple | True |
| 1 | banana | True |
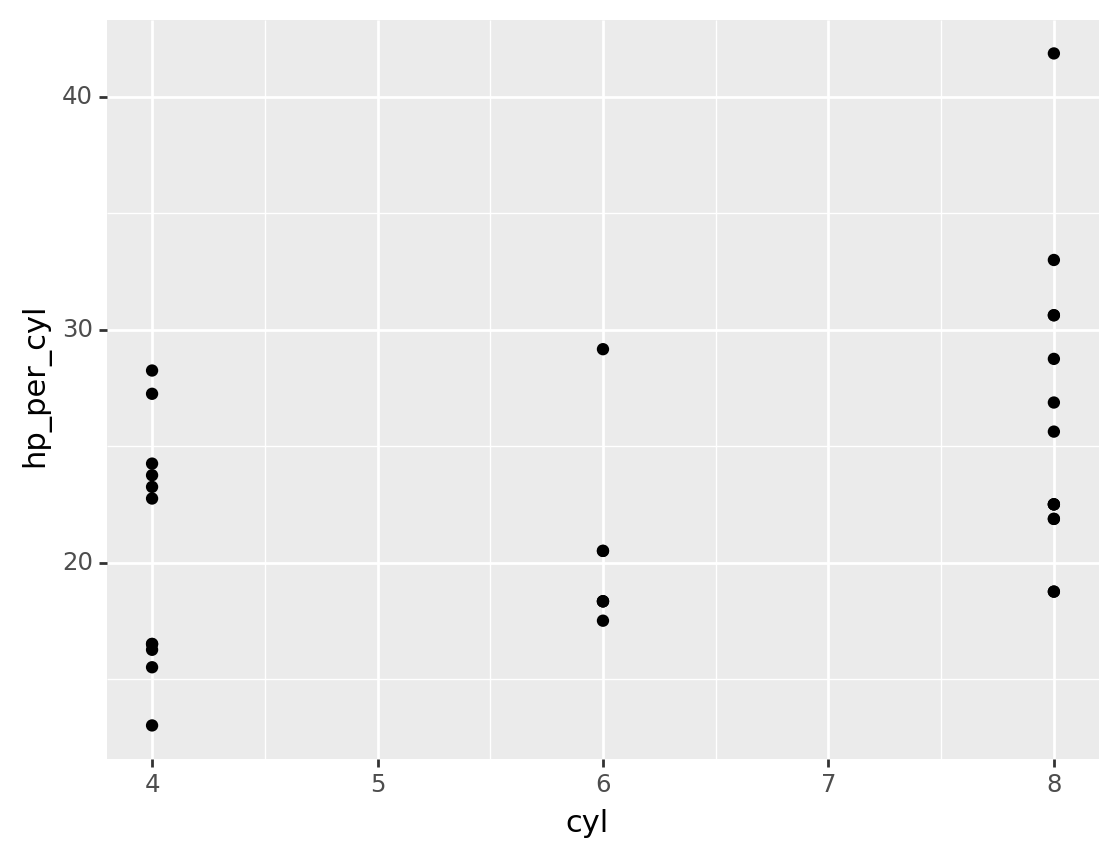
Fortnuately, plotnine supports siuba’s style of piping, so is easy to plug in to!
from siuba import mutate, _
from plotnine import ggplot, aes, geom_point

(mtcars
  >> mutate(hp_per_cyl = _.hp / _.cyl)
  >> ggplot(aes("cyl", "hp_per_cyl"))
   + geom_point()
)
<ggplot: (8761248305454)>